Remaining-useful-life prediction for turbofan engines, with the test engines still unopened
RUL prediction with calibrated intervals, a cost-based maintenance policy and a streaming fleet replay
Summary
- Problem
- Maintenance scheduled too early wastes money; too late risks failure in service. A useful prediction needs an honest error bar and a policy that shows when planning pays. A research demonstration on public engine data.
- My role
- Sole developer
- Team
- Personal project
- Status
- In progress
- Timeline
- October 2026
- Stack
- Python, PyTorch, LightGBM, scikit-learn, Parquet, Docker
- Next
- Score the held-out group of 10 engines once, then deploy the replay to the free-tier host.
What shipped
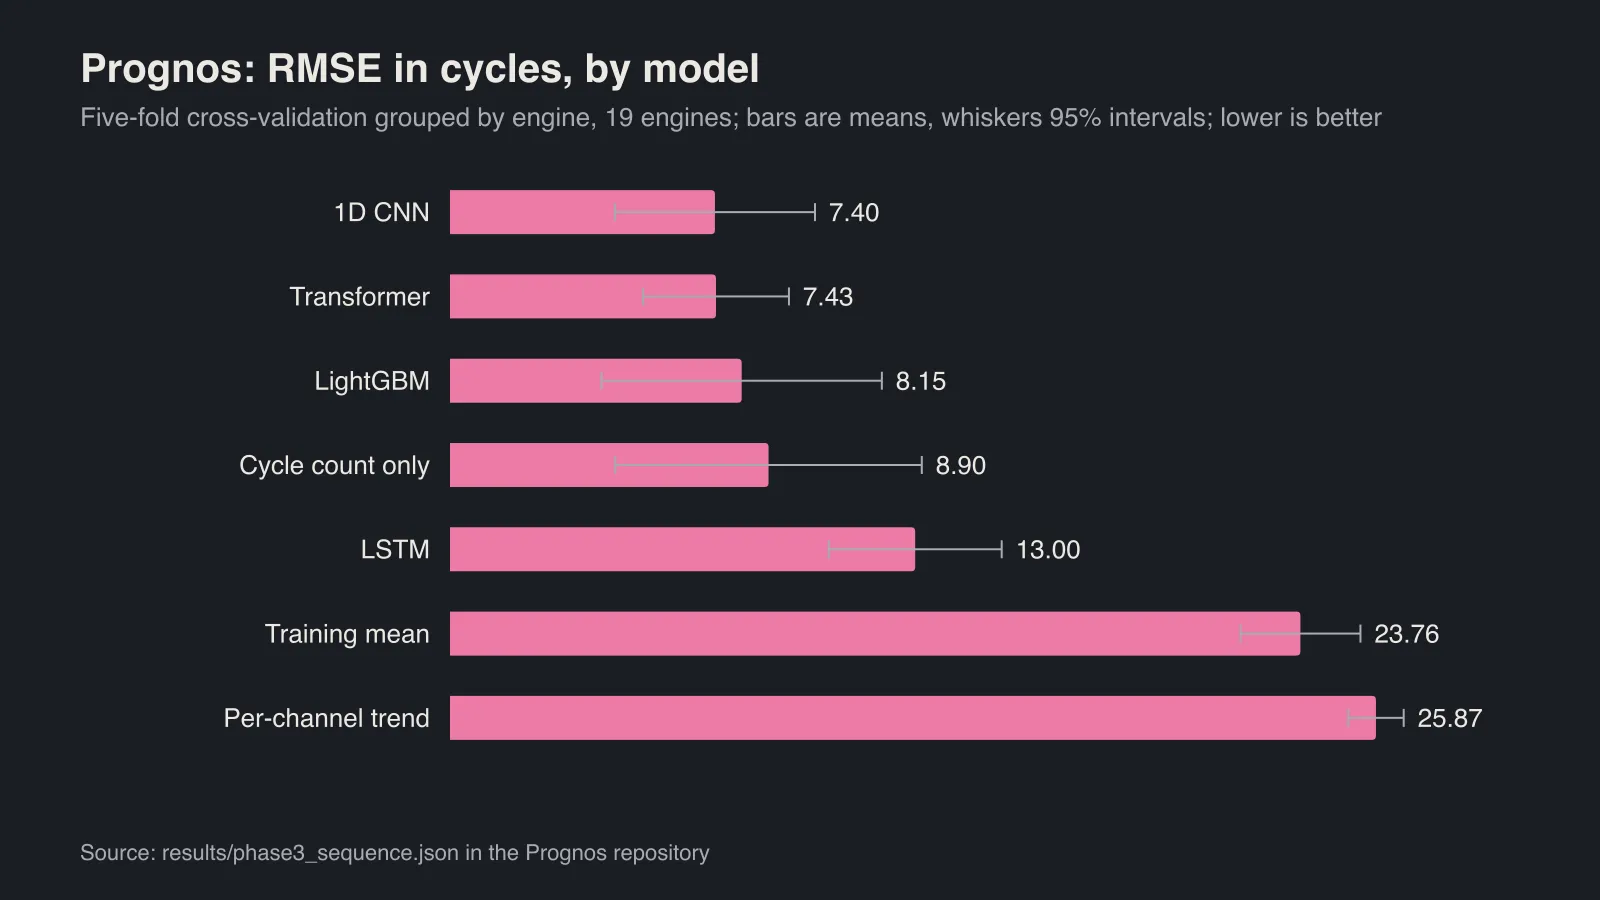
- Reduced remaining-life error to 7.40 cycles RMSE, against 8.90 for cycle count alone, in cross-validation over 19 engines, by training a 1D CNN; 10 test engines are unscored.
- Showed that planned maintenance pays above a cost ratio of 1, in an estimated cost model, by acting on the lower bound of conformal prediction intervals.
- Reported a failed LSTM (13.00 RMSE, worse than ignoring the sensors) with its diagnosis instead of tuning it on the reported folds.
- RMSE, best model (cycles)
- 7.40
- Baseline: 8.90 from cycle count alone, with no sensors
- 1D CNN, 5-fold cross-validation grouped by engine over 19 engines (results/phase3_sequence.json), 95% interval 4.61–10.20 resampled by engine; the 10-engine test group has not been scored yet
- LSTM RMSE
- 13.00
- Baseline: 8.90 cycle-count floor
- Same folds; the LSTM did worse than ignoring the sensors, and the likely cause (its readout) was left unfixed to avoid tuning on the reported folds
- Planning against run-to-failure (estimate)
- Wins above a cost ratio of 1
- Modelled savings of the lower-bound policy across cost ratios of 1 to 100 (results/phase4_policy.json); at ratio 1 planning loses by 20.9–90.2 cost units, above it planning wins. The cost figures are assumptions, so these are estimates
On this page
Source: results/phase3_sequence.json in the Prognos repository
Context and constraints
The data is NASA’s N-CMAPSS: three sub-datasets (DS01, DS02 and DS06), 29 engines, 20.9 million rows and 199,095 sliding windows. Windows overlap heavily, so every split, interval and comparison is done by engine. The final test group of 10 engines is held closed and will be opened once. The repository calls itself a research demonstration and lists its limitations before any operational conclusion.
Architecture
The raw HDF5 files are converted to Parquet, with health parameters dropped at conversion. One shared feature builder serves every model and the streaming path, so training and serving can’t drift apart. Seven models are compared on the same folds: a 1D CNN, a two-layer Transformer, LightGBM, a cycle-count-only linear model, an LSTM, the training mean and a per-channel trend. Conformal prediction adds intervals, a policy decides maintenance on their lower bound, and a streaming pipeline replays held-out engines as a live fleet behind an API and a cost panel.
Request flows
- Predict and plan maintenance: NASA N-CMAPSS (Parquet) → Shared feature builder → RUL model (1D CNN) with conformal intervals → Lower-bound maintenance policy → API and cost panel → Fleet dashboard
- Replay a live fleet: Streaming replay of held-out engines → Shared feature builder → RUL model (1D CNN) with conformal intervals → Lower-bound maintenance policy
Engineering decisions
How should the data be split?
- Options
- Random windows
- By unit number
- By engine
- identified as sub-dataset plus unit
- Chose
- Group by engine, as the pair of sub-dataset and unit, and hold one group out entirely as the final test set
- Trade-off
- With 29 engines the confidence intervals are wide.
- Evidence
- Overlapping windows from one engine are near-duplicates, and unit numbers restart in every sub-dataset; grouping on the bare unit number had earlier merged engines and reported 16 where there are 29.
How are prediction intervals made trustworthy?
- Options
- Model-specific uncertainty
- Conformal prediction
- Chose
- Conformal prediction, with confidence intervals on comparisons resampled by engine rather than by window
- Trade-off
- Intervals are only as good as the calibration data, and with few engines they are wide.
- Evidence
- Resampling windows would treat two views of one engine as independent and report a narrower, misleading interval.
What should the maintenance policy act on?
- Options
- The point prediction
- The lower bound of the interval
- Chose
- The lower bound
- Trade-off
- Engines come out of service earlier than the point prediction suggests, which costs planned visits.
- Evidence
- Across the cost sweep the lower-bound policy recorded no failures, and the crossover where planning starts to pay doesn't depend on the cost figures chosen.
Why keep a model that failed?
- Options
- Drop the LSTM
- Tune it until it wins
- Report it with its diagnosis
- Chose
- Report it with its diagnosis and leave the fix for a fresh run
- Trade-off
- The table shows a clearly weak model.
- Evidence
- Its error is 14.06 early, 7.63 mid-life and 15.02 late, consistent with a readout that uses only the final hidden state; fixing it on these folds would be tuning on the set being reported.
Evaluation
Cross-validation over 19 engines, five folds grouped by engine; 95% intervals come from resampling by engine.
| Model | RMSE | 95% interval | NASA score |
|---|---|---|---|
| 1D CNN | 7.40 | 4.61–10.20 | 24,343 |
| Transformer | 7.43 | 5.39–9.47 | 24,396 |
| LightGBM | 8.15 | 4.23–12.07 | 30,027 |
| Cycle count only, no sensors | 8.90 | 4.62–13.18 | 34,950 |
| LSTM | 13.00 | 10.58–15.41 | 65,732 |
| Training mean | 23.76 | 22.08–25.44 | 283,059 |
| Per-channel trend | 25.87 | 25.09–26.65 | 557,375 |
The intervals of the top models overlap. Every committed result file records the machine, library versions and date, and a CI test fails if this table drifts from the result files.
Deployment and operations
The full seven-model run takes about 55 minutes on an Apple M5. The cost panel serves the committed policy result rather than recomputing it, so the cost model always travels with its numbers. Fault-injection tests cover the streaming path. A deployment path to a free-tier Oracle VM is documented with a verifier, and isn’t live yet.
Results
The best sequence models beat the cycle-count floor, but not by much, and their intervals overlap with it. The LSTM did worse than ignoring the sensors entirely. The maintenance result that doesn’t depend on any cost guess is the crossover: when an in-flight removal costs the same as a shop visit, planning loses; above that ratio it wins, and the gain grows with the ratio. All cost figures are modelled estimates, and the held-out test engines haven’t been scored.
What I'd do next
Open the 10-engine test group once and report it, then try the pooled LSTM readout on a new seed and fold assignment.
Talk about this project
I'm happy to walk through any decision here in more depth.